
NOTE: Reports are available to all users but data will be filtered based on the privileges and access of individual users.
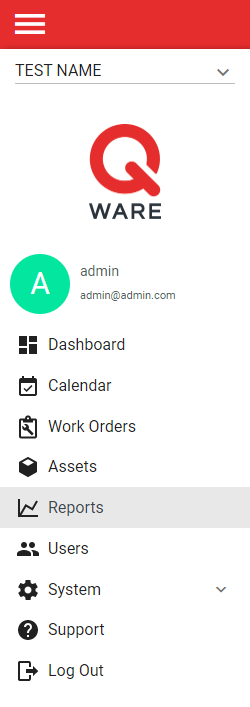
1. Log in to your Q Ware application and navigate to Reports.
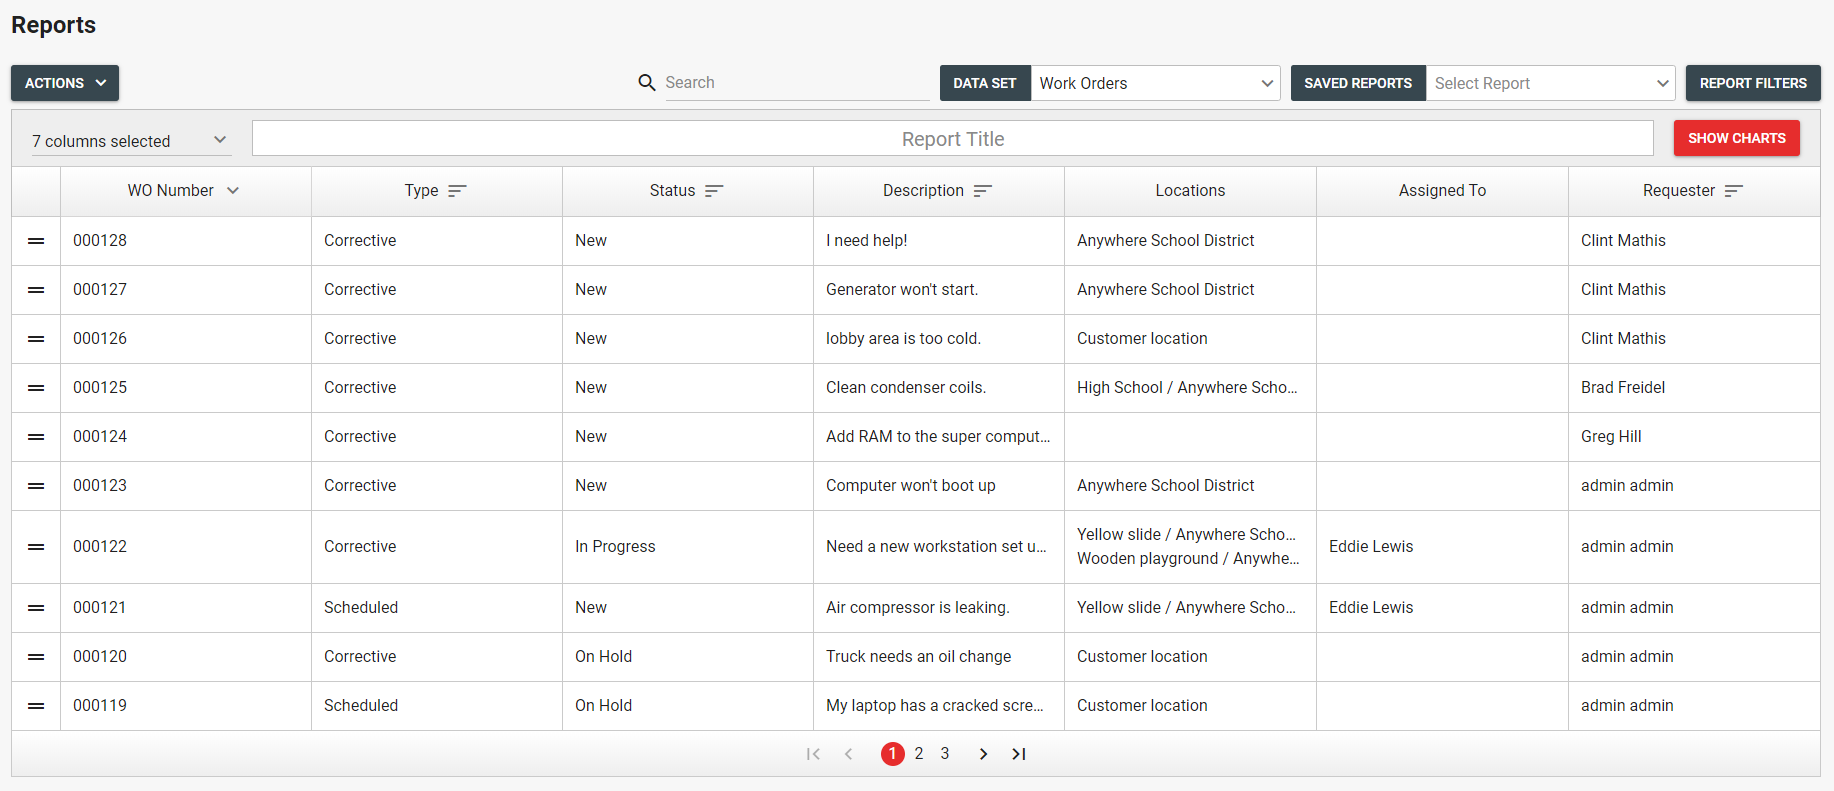
2. From the report interface, modify the report using the following options:
- Select Data Set - work order or asset data can be used to build reports.
- Apply Report Filters - filters can be applied to the data set using any standard or custom fields.
- Adjust Columns - all standard and custom fields are available for selection. Columns can be reordered in the table by dragging and dropping them.
- Search Filter Data - the search field will filter the data set against all visible columns.
- Report Title - provides a title for the report that will show in report exports.
- Add Charts - add charts using data from the selected data set. Available charts include:
- Bar Chart
- Line Chart
- Pie Chart
To learn more about adding charts, please read the tutorial "How to add charts to reports."
7. Reorder Rows - table rows can be reordered by dragging and dropping.
3. Once a report is built it can be exported, printed, or saved.
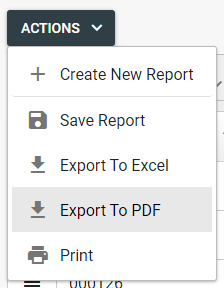
- Export Report - to export the report click the "Actions" button and select "Export to PDF" or "Export to Excel."
- Print Report - to print the report click the "Actions" button and select "Print."
- Save Report - to save the report click the "Actions" button and select "Save Report." Saved reports will be available in the "Saved Reports" drop down.
Comments
0 comments
Please sign in to leave a comment.