
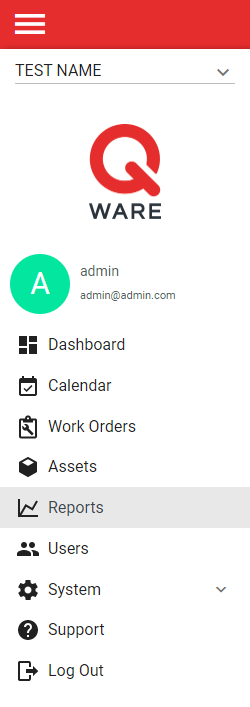
1. Log in to your Q Ware application and navigate to Reports.
2. Select a saved report or configure the report to contain the required data. To learn how to create a report, please read the tutorial "How to create a report."
3. Click "Show Charts."

4. Configure the chart by adding a title, selecting a chart type, and selecting at least one data set property.
NOTE: "Data Set 1" represents what the chart will count. "Data Set 2" represents a second level for categorizing the first data set.
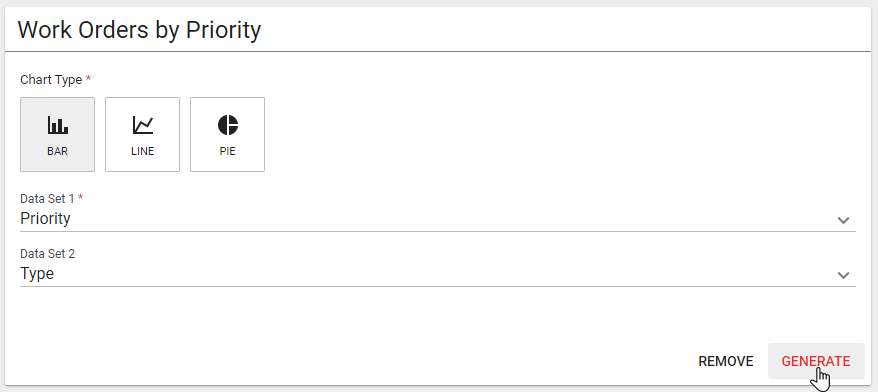
5. Once the chart is configured, click "Generate."
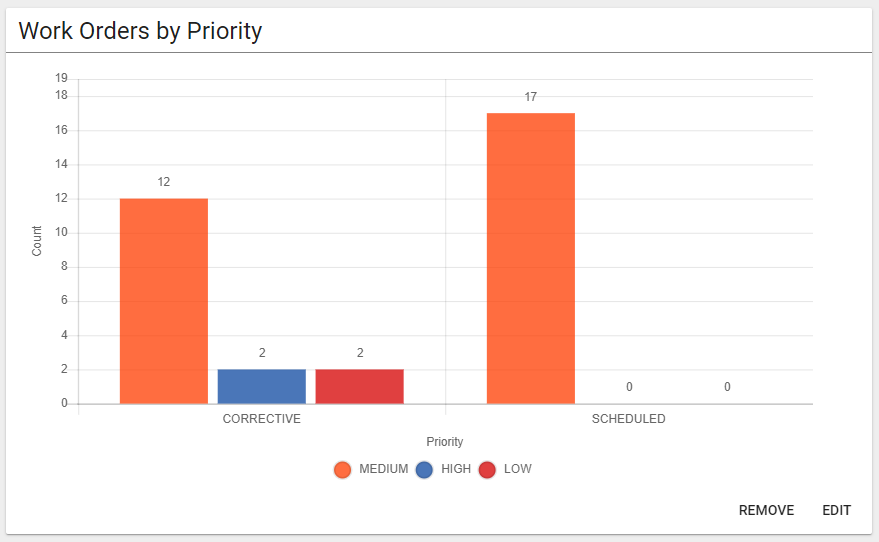
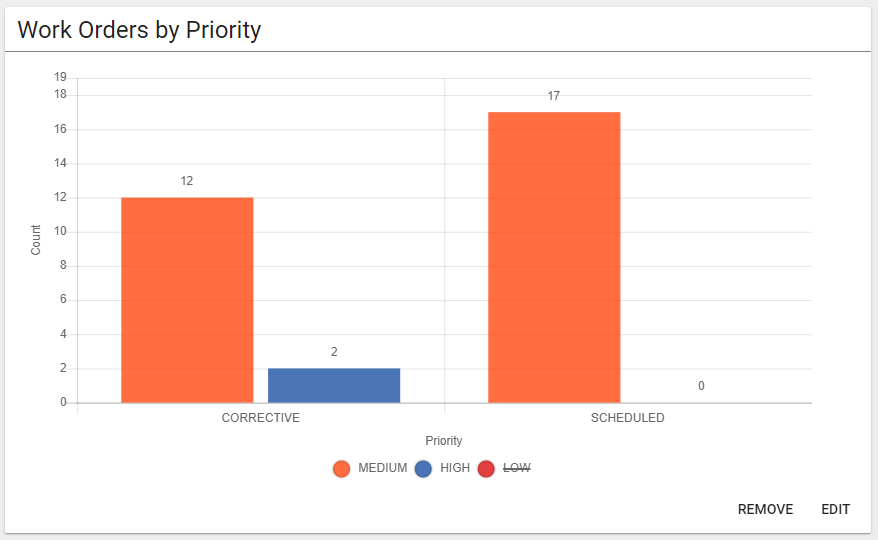
6. Unique values for "Data Set 1" can be excluded from the chart by clicking the legend options.
7. Additional charts can added by clicking the "Add Chart" button.

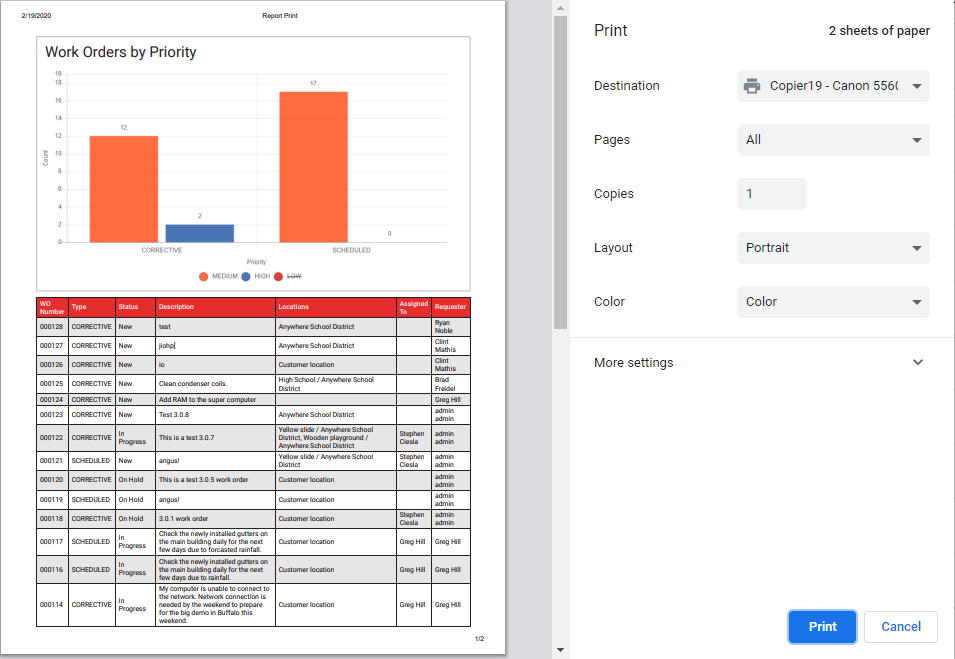
8. Charts are provided when reports are printed or exported to PDF.
Comments
0 comments
Please sign in to leave a comment.